Get Started#


Python versions: 3.10-3.14
OS: Linux, macOS, Windows
Installation#
pip install lets-plot
Quick Start#
 1import numpy as np
 2from lets_plot import *
 3LetsPlot.setup_html()
 4
 5np.random.seed(12)
 6data = dict(
 7    cond=np.repeat(['A', 'B'], 200),
 8    rating=np.concatenate((np.random.normal(0, 1, 200), np.random.normal(1, 1.5, 200)))
 9)
10
11ggplot(data, aes(x='rating', fill='cond')) + ggsize(700, 300) + \
12    geom_density(color='dark_green', alpha=.7) + scale_fill_brewer(type='seq') + \
13    theme(panel_grid_major_x='blank')
 1import numpy as np
 2from lets_plot import *
 3LetsPlot.setup_html()
 4
 5np.random.seed(12)
 6data = dict(
 7    cond=np.repeat(['A', 'B'], 200),
 8    rating=np.concatenate((np.random.normal(0, 1, 200), np.random.normal(1, 1.5, 200)))
 9)
10
11background = element_rect(fill='#14181e')
12ggplot(data, aes(x='rating', fill='cond')) + ggsize(700, 300) + \
13    geom_density(color='dark_green', alpha=.7) + scale_fill_brewer(type='seq') + \
14    flavor_high_contrast_dark() + \
15    theme(panel_grid_major_x='blank', plot_background=background, legend_background=background)
User Guide#

Coding for Economists by Arthur Turrell
Easy Data Visualisation for Tidy Data with Lets-Plot - how to make plots quickly using the declarative plotting.
Python4DS by Arthur Turrell
Data Visualisation - will teach you how to visualise your data using Lets-Plot.
Layers - a deeper dive into aesthetic mappings, geometric objects, and facets.
Exploratory Data Analysis - search for answers by visualising, transforming, and modelling your data.
Data Science with Sanjaya by Sanjaya Subedi
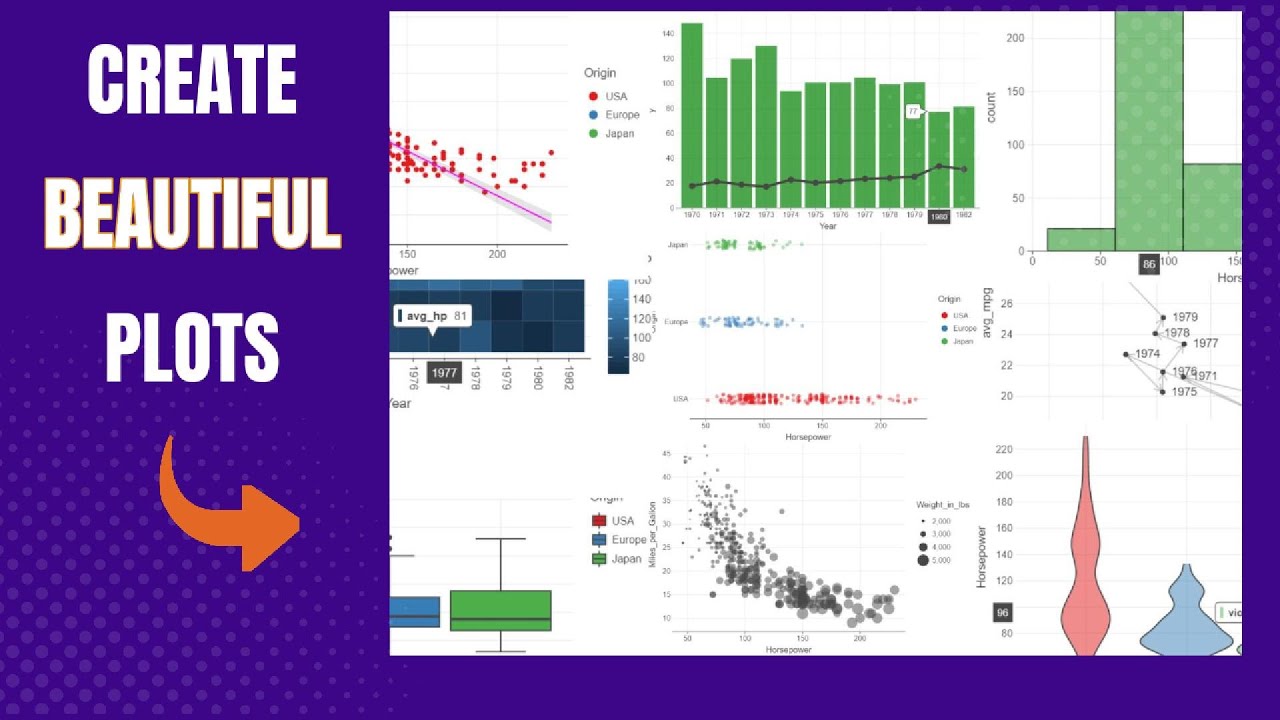
Create Beautiful Plots with Python Let’s Plot Library - Using the Lets-Plot library, the author shows you how to create 10 different but very common types of plots that you’ll see and create often.
Explore Your Data with Lets-Plot#
Key Features#
Inspired by ggplot2
A faithful port of R’s ggplot2 to Python.
You can learn R’s ggplot2 and the grammar of graphics in the “ggplot2: Elegant Graphics for Data Analysis” book by Hadley Wickham.

Multiplatform
A Grammar of Graphics for Python - works in Python notebooks (Jupyter, Datalore, Kaggle, Colab, Deepnote, Nextjournal) as well as in PyCharm and Intellij IDEA IDEs.
A Grammar of Graphics for Kotlin - a Kotlin multiplatform visualization library which fulfills your needs in the Kotlin ecosystem: from Kotlin notebooks to Compose-Multiplatform apps.


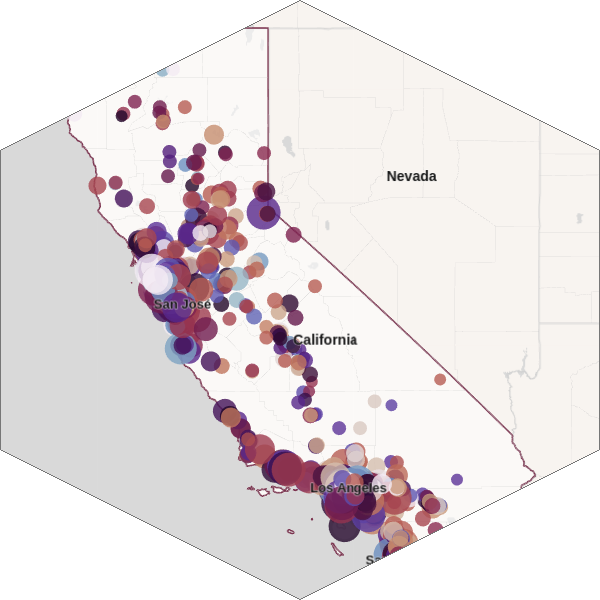
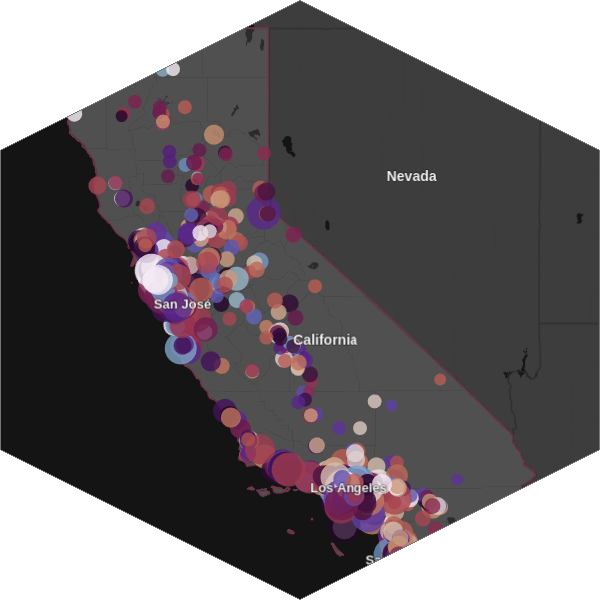
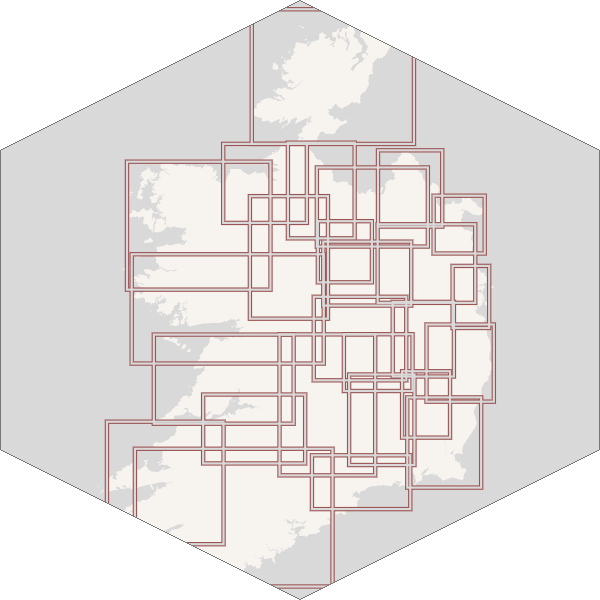
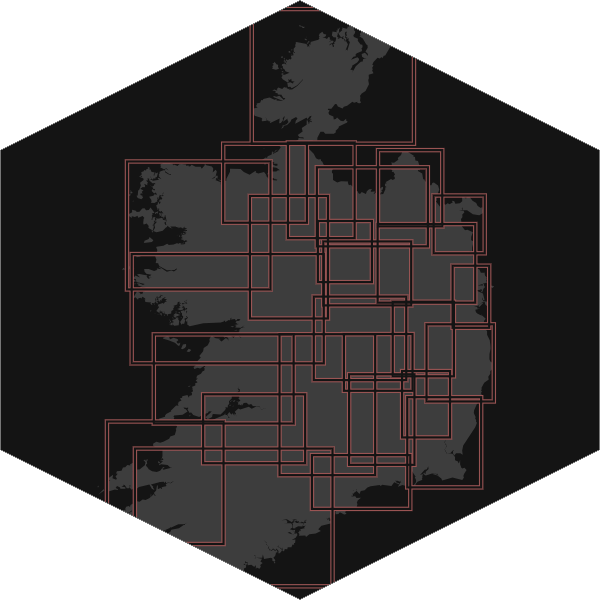
Interactive Maps
Interactive maps allow zooming and panning around your geospatial data with customizable vector or raster basemaps as a backdrop. Learn more.


‘bistro’ Plots
Ready-to-use compound plots - correlation matrices, Q-Q plots, joint plots, residual plots - that combine multiple geoms, scales, and settings into one call. Learn more.


Panning and Zooming
Enable an interactive toolbar with ggtb() to pan and zoom any chart - rubber-band zoom, center-point zoom, and pan tools. Learn more.


Customizable Tooltips and Annotations
You can customize the content, values formatting and appearance of tooltip and annotation for layers of your plot.


Formatting
Lets-Plot supports formatting of numeric and date-time values in tooltips, annotations, legends, on the axes and text geometry layer. Learn more.


Option to Display Plots in External Browser
With the “show externally” mode enabled, you can easily display a plot in an external browser by invoking its show() method. Learn more.


Sampling
Sampling is a special technique of data transformation, which helps to deal with large datasets and overplotting. Learn more.


‘No Javascript’ and Offline Mode
In the ‘no javascript’ mode Lets-Plot generates plots as bare-bones SVG images. Plots in the notebook with option offline=True will be working without an Internet connection. Learn more.