PlotSpec#
- class PlotSpec(data, mapping, scales, layers, metainfo_list=[], is_livemap=False, crs_initialized=False, crs=None, **kwargs)#
A class of the initial plot object.
Do not use this class explicitly.
Instead, you should construct its objects with functions ggplot(),
corr_plot(...).points().build()etc.- __init__(data, mapping, scales, layers, metainfo_list=[], is_livemap=False, crs_initialized=False, crs=None, **kwargs)#
Initialize self.
Extract the data shared by all layers.
- Returns:
- dict or
DataFrame Object data.
- dict or
Examples
1from lets_plot import *
2LetsPlot.setup_html()
3p = ggplot({'x': [0], 'y': [0]}, aes('x', 'y'))
4p += geom_point(data={'x': [1], 'y': [1]})
5p.get_plot_shared_data()
{'x': [0], 'y': [0]}
- has_layers() bool#
Check if the
PlotSpecobject has at least one layer.- Returns:
- bool
True if object has layers.
Examples
1from lets_plot import *
2LetsPlot.setup_html()
3p = ggplot()
4print(p.has_layers())
5p += geom_point(x=0, y=0)
6print(p.has_layers())
False
True
- __add__(other)#
Allow to add different specs to the
PlotSpecobject.Examples
1from lets_plot import *
2LetsPlot.setup_html()
3p = ggplot({'x': [0, 1, 2], 'y': [0, 1, 2]}, aes('x', 'y'))
4l = layer('point', mapping=aes(color='x'))
5s = scale_color_discrete()
6t = theme(axis_title='blank')
7p + l + s + t
- as_dict()#
Return the dictionary of all properties of the object with
as_dict()applied recursively to all subproperties ofFeatureSpectype.- Returns:
- dict
Dictionary of properties.
Examples
1from lets_plot import *
2LetsPlot.setup_html()
3p = ggplot({'x': [0], 'y': [0]}) + geom_point(aes('x', 'y'))
4p.as_dict()
{'data': {'x': [0], 'y': [0]},
 'mapping': {},
 'data_meta': {'series_annotations': [{'type': 'int', 'column': 'x'},
   {'type': 'int', 'column': 'y'}]},
 'kind': 'plot',
 'scales': [],
 'layers': [{'geom': 'point',
   'mapping': {'x': 'x', 'y': 'y'},
   'data_meta': {}}],
 'metainfo_list': []}
- show()#
Draw a plot.
Examples
1from lets_plot import *
2LetsPlot.setup_html()
3p = ggplot() + geom_point(x=0, y=0)
4p.show()
- to_svg(path=None, w=None, h=None, unit=None) str#
Export the plot in SVG format.
Plots containing
geom_livemap()are not supported.- Parameters:
- self
PlotSpec Plot specification to export.
- pathstr, file-like object, default=None
Can be either a string specifying a file path or a file-like object. If a string is provided, the result will be exported to the file at that path. If a file-like object is provided, the result will be exported to that object. If None is provided, the result will be returned as a string.
- wfloat, default=None
Width of the output image in units.
- hfloat, default=None
Height of the output image in units.
- unit{‘in’, ‘cm’, ‘mm’, ‘px’}, default=’in’
Unit of the output image. One of: ‘in’, ‘cm’, ‘mm’ or ‘px’.
- self
- Returns:
- str
Absolute pathname of created file, SVG content as a string or None if a file-like object is provided.
Examples
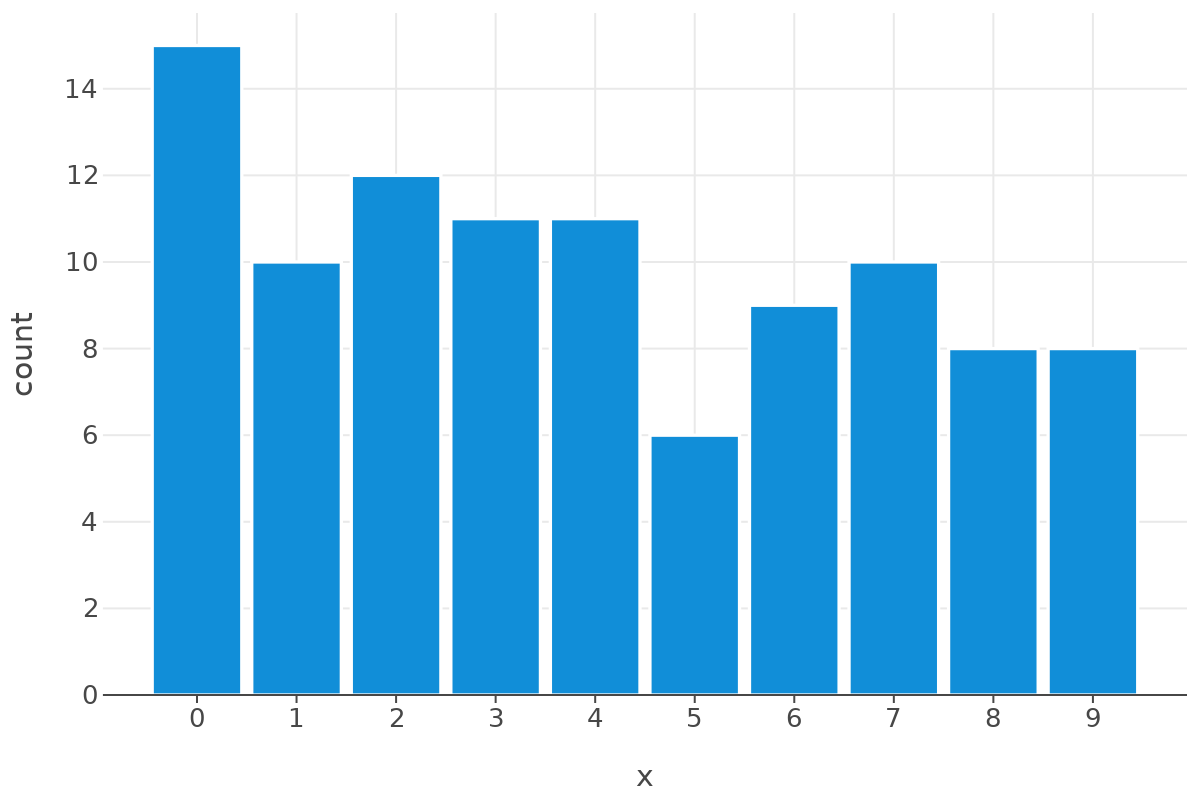
 1import numpy as np
 2import io
 3from lets_plot import *
 4from IPython import display
 5LetsPlot.setup_html()
 6np.random.seed(42)
 7x = np.random.randint(10, size=100)
 8p = ggplot({'x': x}, aes(x='x')) + geom_bar()
 9file_like = io.BytesIO()
10p.to_svg(file_like)
11display.SVG(file_like.getvalue())

- to_html(path=None, iframe: bool = None) str#
Export the plot in HTML format.
- Parameters:
- self
PlotSpec Plot specification to export.
- pathstr, file-like object, default=None
Can be either a string specifying a file path or a file-like object. If a string is provided, the result will be exported to the file at that path. If a file-like object is provided, the result will be exported to that object. If None is provided, the result will be returned as a string.
- iframebool, default=False
Whether to wrap HTML page into a iFrame.
- self
- Returns:
- str
Absolute pathname of created file, HTML content as a string or None if a file-like object is provided.
Examples
 1import io
 2from IPython.display import HTML
 3import numpy as np
 4from lets_plot import *
 5LetsPlot.setup_html()
 6np.random.seed(42)
 7x = np.random.randint(10, size=100)
 8p = ggplot({'x': x}, aes(x='x')) + geom_bar()
 9file_like = io.BytesIO()
10p.to_html(file_like)
11HTML(file_like.getvalue().decode('utf-8'))
- to_png(path, scale: float = None, w=None, h=None, unit=None, dpi=None) str#
Export a plot to a file or to a file-like object in PNG format.
Plots containing
geom_livemap()are not supported.- Parameters:
- self
PlotSpec Plot specification to export.
- pathstr, file-like object
Can be either a string specifying a file path or a file-like object. If a string is provided, the result will be exported to the file at that path. If a file-like object is provided, the result will be exported to that object.
- scalefloat
Scaling factor for raster output. Default value is 2.0.
- wfloat, default=None
Width of the output image in units.
- hfloat, default=None
Height of the output image in units.
- unit{‘in’, ‘cm’, ‘mm’, ‘px’}, default=’in’
Unit of the output image. One of: ‘in’, ‘cm’, ‘mm’ or ‘px’.
- dpiint, default=300
Resolution in dots per inch. The default value depends on the unit:
for ‘px’ it is 96 (output image will have the same pixel size as
wandhvalues)for physical units (‘in’, ‘cm’, ‘mm’) it is 300
- self
- Returns:
- str
Absolute pathname of created file or None if a file-like object is provided.
Notes
If
w,h,unit, anddpiare all specified:The plot’s pixel size (default or set by ggsize()) is ignored.
The output size is calculated using the specified
w,h,unit, anddpi.The plot is resized to fit the specified
wxharea, which may affect the layout, tick labels, and other elements.
If only
dpiis specified:The plot’s pixel size (default or set by ggsize()) is converted to inches using the standard display PPI of 96.
The output size is then calculated based on the specified DPI.
The plot maintains its aspect ratio, preserving layout, tick labels, and other visual elements.
Useful for printing - the plot will appear nearly the same size as on screen.
If
w,hare not specified:The
scaleparameter is used to determine the output size.The plot maintains its aspect ratio, preserving layout, tick labels, and other visual elements.
Useful for generating high-resolution images suitable for publication.
Examples
 1import numpy as np
 2import io
 3from lets_plot import *
 4from IPython import display
 5LetsPlot.setup_html()
 6np.random.seed(42)
 7x = np.random.randint(10, size=100)
 8p = ggplot({'x': x}, aes(x='x')) + geom_bar()
 9file_like = io.BytesIO()
10p.to_png(file_like)
11display.Image(file_like.getvalue())
- to_pdf(path, scale: float = None, w=None, h=None, unit=None, dpi=None) str#
Export a plot to a file or to a file-like object in PDF format.
Plots containing
geom_livemap()are not supported.- Parameters:
- self
PlotSpec Plot specification to export.
- pathstr, file-like object
Can be either a string specifying a file path or a file-like object. If a string is provided, the result will be exported to the file at that path. If a file-like object is provided, the result will be exported to that object.
- scalefloat
Scaling factor for raster output. Default value is 2.0.
- wfloat, default=None
Width of the output image in units.
- hfloat, default=None
Height of the output image in units.
- unit{‘in’, ‘cm’, ‘mm’, ‘px’}, default=’in’
Unit of the output image. One of: ‘in’, ‘cm’, ‘mm’ or ‘px’.
- dpiint, default=300
Resolution in dots per inch. The default value depends on the unit:
for ‘px’ it is 96 (output image will have the same pixel size as
wandhvalues)for physical units (‘in’, ‘cm’, ‘mm’) it is 300
- self
- Returns:
- str
Absolute pathname of created file or None if a file-like object is provided.
Notes
If
w,h,unit, anddpiare all specified:The plot’s pixel size (default or set by ggsize()) is ignored.
The output size is calculated using the specified
w,h,unit, anddpi.The plot is resized to fit the specified
wxharea, which may affect the layout, tick labels, and other elements.
If only
dpiis specified:The plot’s pixel size (default or set by ggsize()) is converted to inches using the standard display PPI of 96.
The output size is then calculated based on the specified DPI.
The plot maintains its aspect ratio, preserving layout, tick labels, and other visual elements.
Useful for printing - the plot will appear nearly the same size as on screen.
If
w,hare not specified:The
scaleparameter is used to determine the output size.The plot maintains its aspect ratio, preserving layout, tick labels, and other visual elements.
Useful for generating high-resolution images suitable for publication.
Examples
 1import numpy as np
 2import io
 3import os
 4from lets_plot import *
 5from IPython import display
 6LetsPlot.setup_html()
 7n = 60
 8np.random.seed(42)
 9x = np.random.choice(list('abcde'), size=n)
10y = np.random.normal(size=n)
11p = ggplot({'x': x, 'y': y}, aes(x='x', y='y')) + geom_jitter()
12file_like = io.BytesIO()
13p.to_pdf(file_like)