GeoPandas Support (GeoPandas and Shapely)#
GeoPandas GeoDataFrame is a tabular data structure that contains a set of shapes (geometry) per each observation.
GeoDataFrame extends pandas DataFrame and as such, aside from the geometry, can contain other data.
GeoPandas supports the following three basic classes of geometric objects (shapes):
Points / Multi-Points
Lines / Multi-Lines
Polygons / Multi-Polygons
All GeoPandas shapes are “understood” by Lets-Plot and can be plotted using various geometry layers, depending on the type of the shape.
Use:
geom_point(),geom_pointdensity(),geom_pie(),geom_text()with Points / Multi-Pointsgeom_path()with Lines / Multi-Linesgeom_polygon(),geom_map()with Polygons / Multi-Polygonsgeom_rect()when used with Polygon shapes will display corresponding bounding boxes
Plot Preliminaries#
import pandas as pd

from lets_plot.geo_data import *
from lets_plot import *
LetsPlot.setup_html()

df = pd.DataFrame({
    'state': ['IL', 'IN', 'MI', 'OH', 'WI'],
    'pop_2021': [12_569_321, 6_805_663, 9_992_427, 11_714_618, 5_852_490],
})
gdf = geocode_states(names=df.state).scope('US').get_boundaries()[['state', 'geometry']]
The geodata is provided by © OpenStreetMap contributors and is made available here under the Open Database License (ODbL).
Use Cases#
Depending on the situation, for spatial data we use either parameter data or map or both.
Use either data or map Parameter#
Suppose we have the following data:
gdf
| state | geometry | |
|---|---|---|
| 0 | IL | MULTIPOLYGON (((-89.13301 36.982, -89.25478 37... |
| 1 | IN | MULTIPOLYGON (((-84.81993 39.10544, -84.89739 ... |
| 2 | MI | MULTIPOLYGON (((-90.41862 46.56636, -89.9571 4... |
| 3 | OH | MULTIPOLYGON (((-82.59342 38.42186, -82.84431 ... |
| 4 | WI | MULTIPOLYGON (((-91.21771 43.50055, -91.24454 ... |
ggplot() + geom_map(data=gdf)
ggplot() + geom_map(map=gdf)
Use data Parameter#
If you want to use aesthetics, the data parameter is the only choice:
ggplot() + geom_map(aes(fill='state'), color='white', data=gdf)
Use Both: data and map Parameters#
Suppose you also have a dataframe with population data:
df
| state | pop_2021 | |
|---|---|---|
| 0 | IL | 12569321 |
| 1 | IN | 6805663 |
| 2 | MI | 9992427 |
| 3 | OH | 11714618 |
| 4 | WI | 5852490 |
dataparameter for the “population” dataframe,mapparameter for the state boundariesGeoDataframe.
The 3rd parameter, map_join, will help to combine population values and state boundaries on the same chart:
ggplot() + geom_map(aes(fill='pop_2021'), color='white', data=df, map=gdf, map_join='state')
use_crs Parameter#
Specify EPSG code of coordinate reference system (CRS). All coordinates in GeoDataFrame will be projected to this CRS.
ggplot() + geom_map(map=gdf, use_crs="EPSG:32616")
GeoDataframes already contains coordinates in the desired CRS and should not be reprojected any further.gdf_utm = gdf.to_crs("EPSG:32616")
ggplot() + geom_map(map=gdf_utm, use_crs="provided")
Interactive Maps#
Apart from the use_crs parameter, GeoDataFrames are fully supported on Lets-Plot interactive maps.
When used in combination with geom_livemap(),
the value of the use_crs parameter is ignored and all coordinates are reprojected using the Mercator projection.
ggplot() + geom_livemap() + geom_map(aes(fill='state'), data=gdf, alpha=.5)
Examples#
The world map with Lets-Plot and GeoPandas: link
Plotting Airbnb prices Boston: Datalore link
Spatial prediction of soil pollutants with multi-output Gaussian processes: Nextjournal link
Using geom_imshow() to draw DEM on map: link
use_crsparameter: link
Using exotic map projections: link
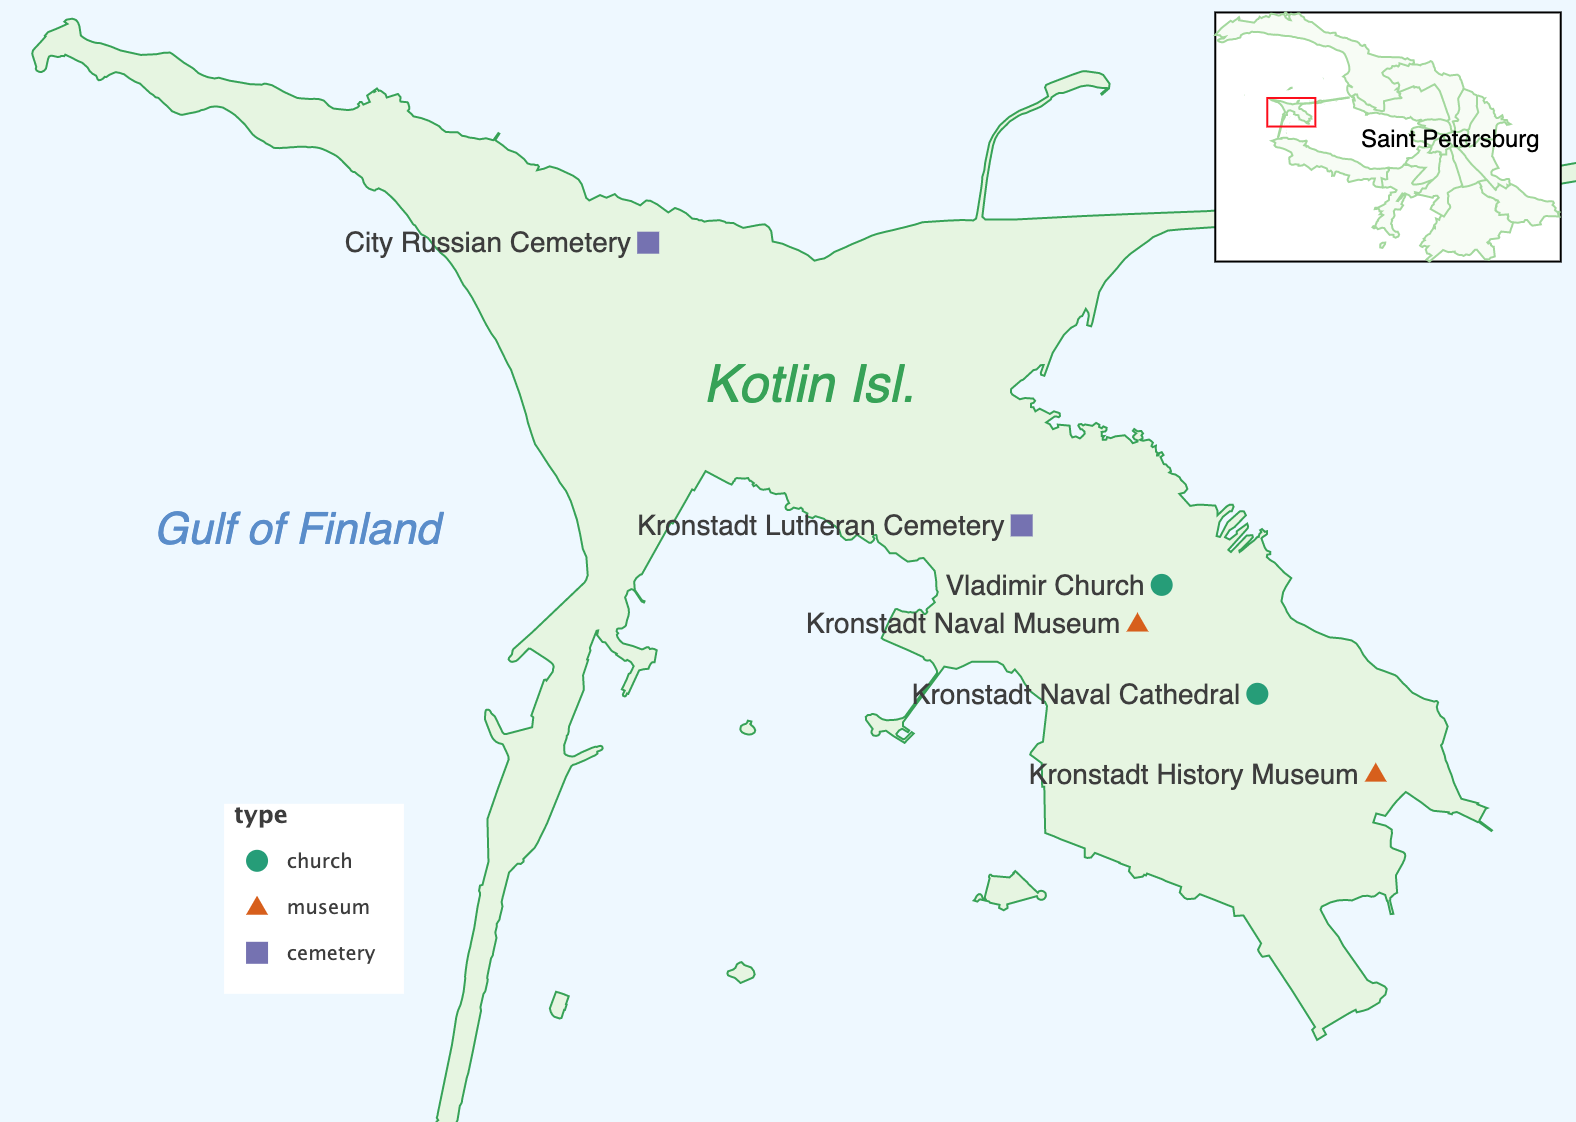
An inset map of Kotlin island: link