Export Plot to SVG, PDF, HTML, PNG#
import io

import numpy as np
import pandas as pd

from lets_plot import *
LetsPlot.setup_html()
df = pd.read_csv("https://raw.githubusercontent.com/JetBrains/lets-plot-docs/master/data/iris.csv")
print(df.shape)
df.head()
(150, 5)
| sepal_length | sepal_width | petal_length | petal_width | species | |
|---|---|---|---|---|---|
| 0 | 5.1 | 3.5 | 1.4 | 0.2 | setosa |
| 1 | 4.9 | 3.0 | 1.4 | 0.2 | setosa |
| 2 | 4.7 | 3.2 | 1.3 | 0.2 | setosa |
| 3 | 4.6 | 3.1 | 1.5 | 0.2 | setosa |
| 4 | 5.0 | 3.6 | 1.4 | 0.2 | setosa |
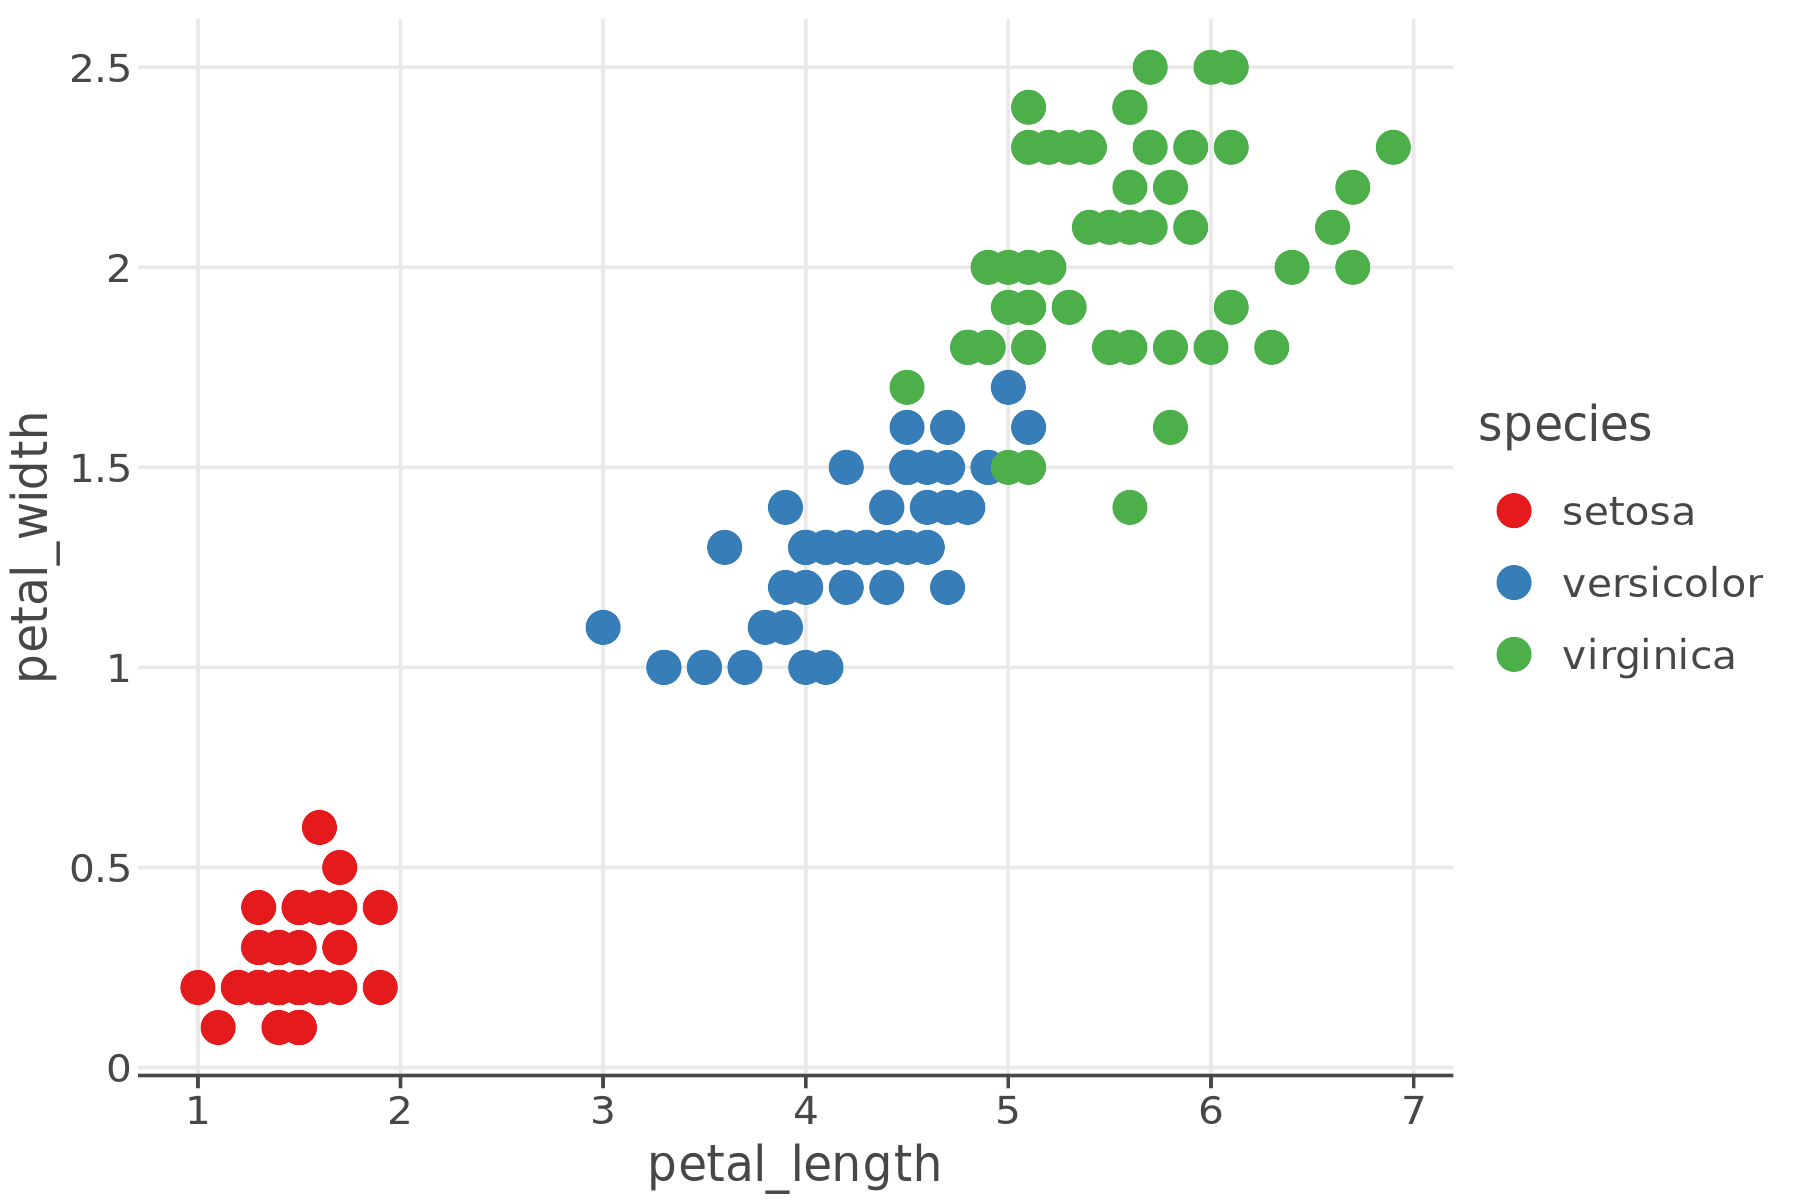
p = ggplot(df) + geom_point(aes("petal_length", "petal_width", color="species"), size=5) + ggsize(600, 400)
p
Export Using ggsave()#
The ggsave() function is an easy way to export plot to a file in SVG, PDF, HTML or PNG formats.
Export SVG to File#
fullpath_svg = ggsave(p, "plot.svg")
Load and display saved SVG.
from IPython.display import SVG

SVG(filename=fullpath_svg)

Export PDF to File#
fullpath_pdf = ggsave(p, "plot.pdf")
This is what the PDF file looks like:
import base64
import urllib.request
from IPython.display import HTML

data = urllib.request.urlopen("https://github.com/JetBrains/lets-plot-docs/raw/master/source/examples/cookbook/lets-plot-images/plot.pdf").read()
b64 = base64.b64encode(data).decode("ascii")

HTML(f'<embed src="data:application/pdf;base64,{b64}" type="application/pdf" width="600" height="400">')
Export HTML to File#
By default, when exporting HTML, ggsave wraps the HTML of the plot in an iframe that matches the size of the plot.
fullpath_html = ggsave(p, "plot.html")
Load and display saved HTML.
HTML(filename=fullpath_html)
Use the iframe=False option to only export the HTML of the plot, without adding an iframe.
fullpath_no_iframe = ggsave(p, "no_iframe_plot.html", iframe=False)
HTML(filename=fullpath_no_iframe)
Export to PNG File#
To save plot as a PNG file use a filename that have “png” extension.
fullpath_png = ggsave(p, "plot.png")
Load and display saved PNG.
from IPython.display import Image

Image(filename=fullpath_png, width=600, height=400)

Export Plot to a File or File-Like Object#
You can export figure created by ggplot() or gggrid() functions
to a vector or raster format using the following methods:
to_svg(path)to_html(path, iframe)to_png(path, scale)to_pdf(path, scale)
To save plot to a file on disc, specify the file’ pathname in path.
To stream plot image to a file-like object, supply such object in the path parameter instead of a pathname.
Saving to a File#
path = p.to_svg("lets-plot-images/to_svg_plot.svg")
SVG(path)

Wrighting to a Stream of In-Memory Bytes#
stream = io.BytesIO()

p.to_svg(stream)
SVG(stream.getvalue())

Adjusting the Size and Aspect Ratio#
Parameter scale#
# default scale is 2.0
img_scale_default = ggsave(p, "scale_default_plot.png")
Image(filename=img_scale_default)
# use custom scale
img_scale_1 = ggsave(p, "scale_1_plot.png", scale=1)
Image(filename=img_scale_1)
Parameters w, h, unit and dpi#
These parameters allow you to configure the export of your plot:
wandh: Define the width and height of the output image in the specified unit.unit: Specifies the unit of measurement ('in','cm','mm'or'px').dpi: Sets the resolution in dots per inch.
This is how they work for PNG and PDF formats:
If
w,h,unitanddpiare all specified:The plot’s pixel size (default or set by
ggsize()) is ignored.The output size is calculated using the specified
w,h,unitanddpi.The plot is resized to fit the specified
wxharea, which may affect the layout, tick labels and other elements.
If only
dpiis specified:The plot’s pixel size (default or set by
ggsize()) is converted to inches using the standard display PPI of 96.The output size is then calculated based on the specified DPI.
The plot maintains its aspect ratio, preserving layout, tick labels and other visual elements.
Useful for printing - the plot will appear nearly the same size as on screen.
If
w,hare not specified:The
scaleparameter is used to determine the output size.The plot maintains its aspect ratio, preserving layout, tick labels and other visual elements.
Useful for generating high-resolution images suitable for publication.
For SVG format:
If
w,handunitare specified:The plot’s pixel size (default or set by
ggsize()) is ignored.The output size is calculated using the specified
w,handunit.
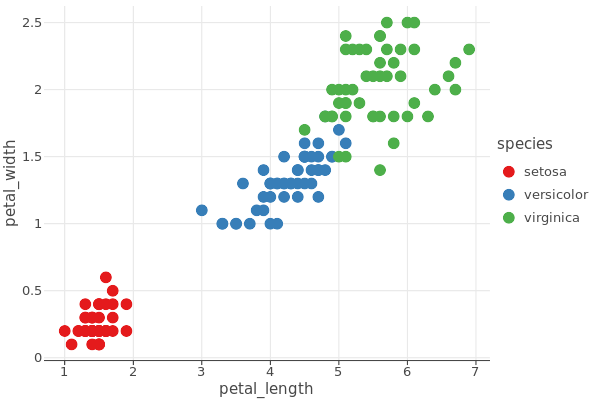
Parameters w and h
The w and h parameters override plot size, allowing to specify the output image size independently of the plot size.
img_square = ggsave(p, "square_plot.png", w=4, h=4, unit='in', dpi=100)
Image(filename=img_square)
72 dpi
img_72 = ggsave(p, "72dpi_plot.png", w=6, h=4, unit='in', dpi=72)
Image(filename=img_72, width=900, height=600)

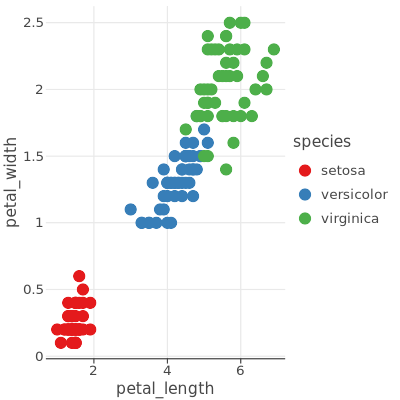
300 dpi
img_300 = ggsave(p, "300dpi_plot.png", w=6, h=4, unit='in', dpi=300)
Image(filename=img_300, width=900, height=600)