Lets-Plot — multiplatform plotting library built on the principles of the Grammar of Graphics
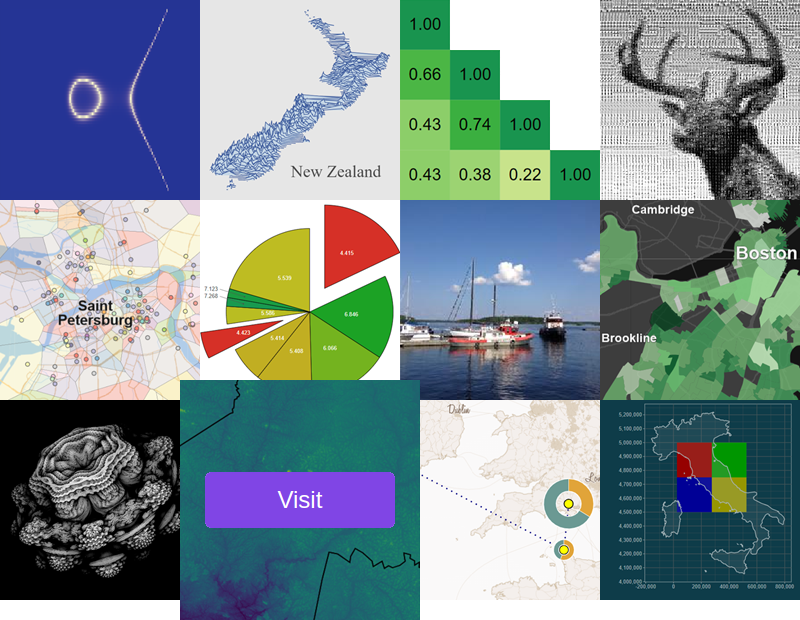
At a Glance
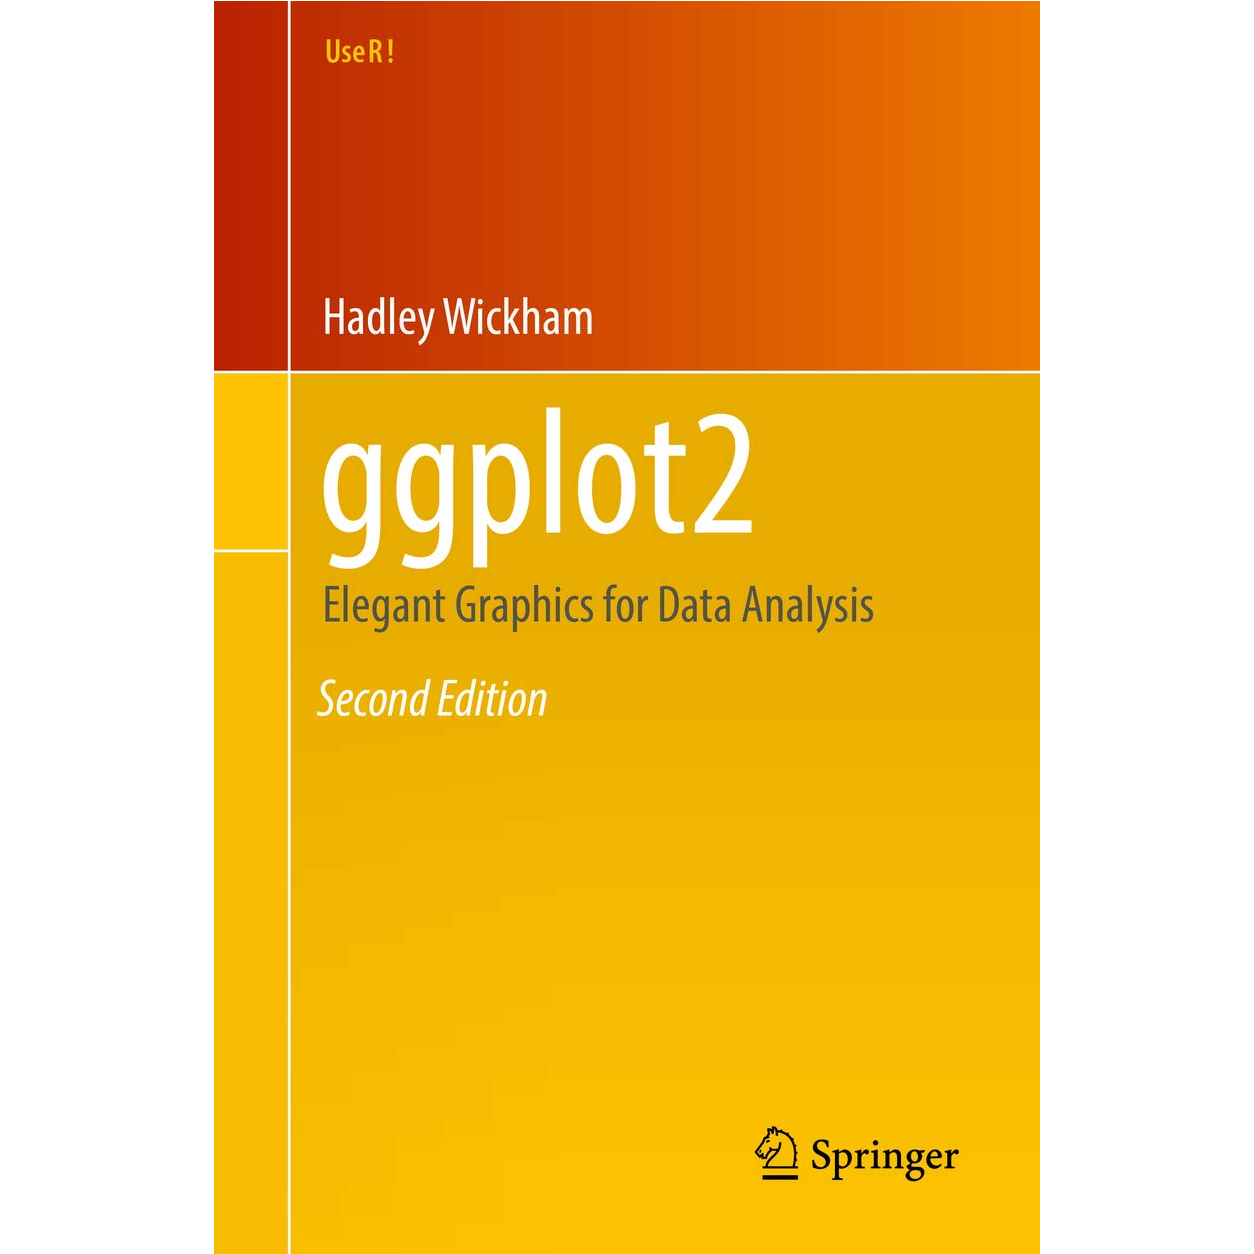
Inspired by ggplot2
A faithful port of R’s ggplot2 to Python and Kotlin.
You can learn R’s ggplot2 and the grammar of graphics in the “ggplot2: Elegant Graphics for Data Analysis” book by Hadley Wickham.

Multiplatform
A Grammar of Graphics for Python - a Python visualization library. You can use it in Python notebooks as well as in PyCharm and Intellij IDEA IDEs.
A Grammar of Graphics for Kotlin - a Kotlin multiplatform visualization library which fulfills your needs in the Kotlin ecosystem: from Kotlin notebooks to Compose-Multiplatform apps.


Customizable Tooltips and Annotations
You can customize the content, values formatting and appearance of tooltip and annotation for layers of your plot.