Presentation Options
General Functions
theme(), ggtitle(), ggsize(), xlab(), ylab(), labs(), guideLegend(), guideColorbar(), guides()
Cookbooks
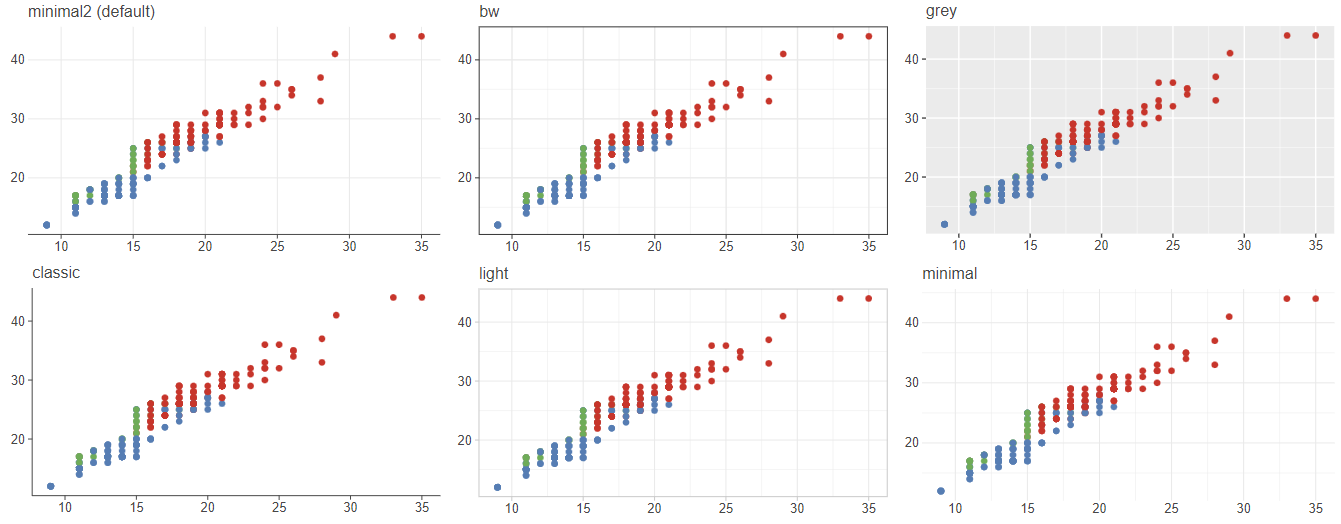
Predefined Themes
minimal2, bw, grey (or gray), classic, light, minimal, void, none
Predefined Themes Cookbooks
Color Schemes (Flavors)
darcula, solarized light, solarized dark, high contrast light, high contrast dark, standard
Flavors Cookbooks
Plot Layout Diagrams
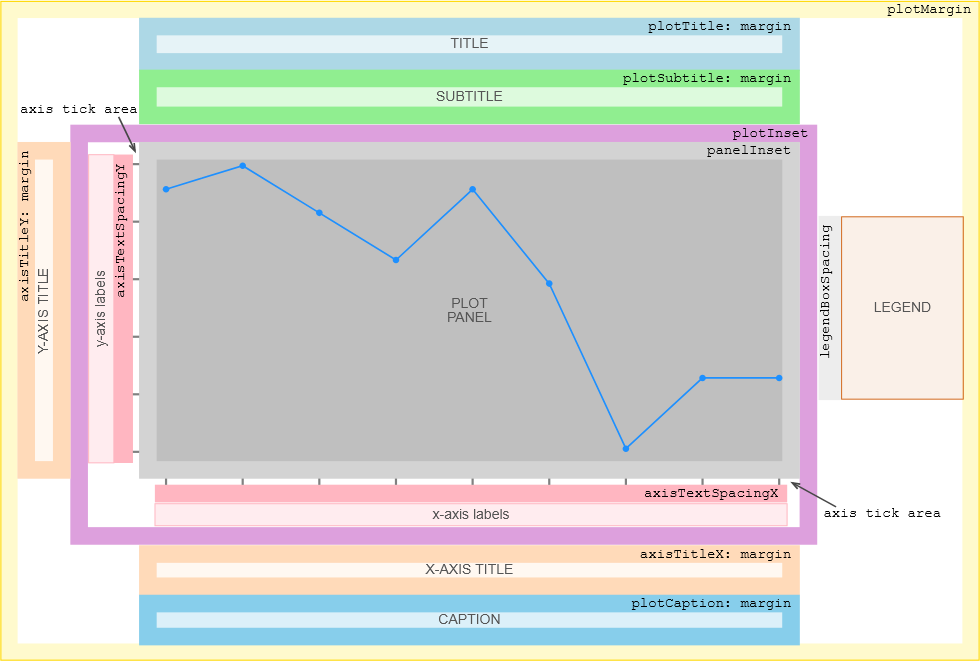
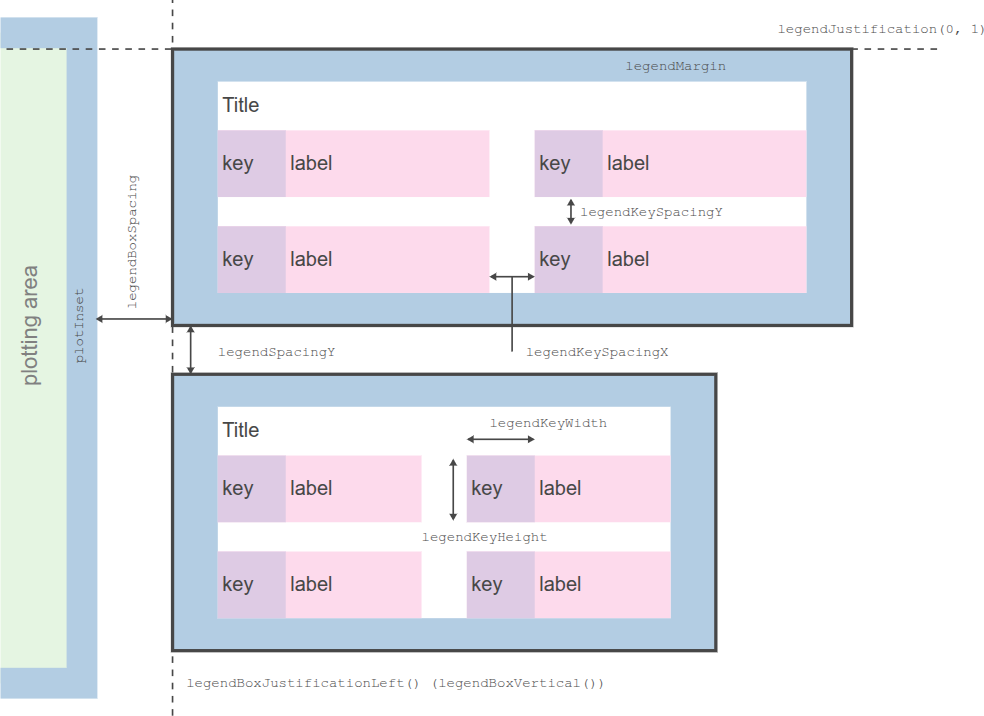
These diagrams illustrate layout options and their spatial relationships within plot components.
Option names on the diagrams (e.g., axisTextSpacingX) correspond to theme() function arguments.
Simple options accept numeric values directly, e.g. theme(axisTextSpacingX = 10).
Composite options shown as axisTitleX: margin accept elementText() or elementRect() function results, e.g. theme(axisTitleX = elementText(margin = listOf(5, 5))).
Plot Panel Layout

Legend Box Layout

03 December 2025

