'bistro' Plots
"Bistro" plots is a collection of "compound plots" allowing users to generate intricate charts without the need for extensive coding.
These plots build upon lets-plot's core functionality, combining multiple geoms, scales, and settings into ready-to-use functions.
Correlation Plot
CorrPlot - builder that takes a dataframe (Kotlin Map<*, *>) as the input and builds a correlation plot.
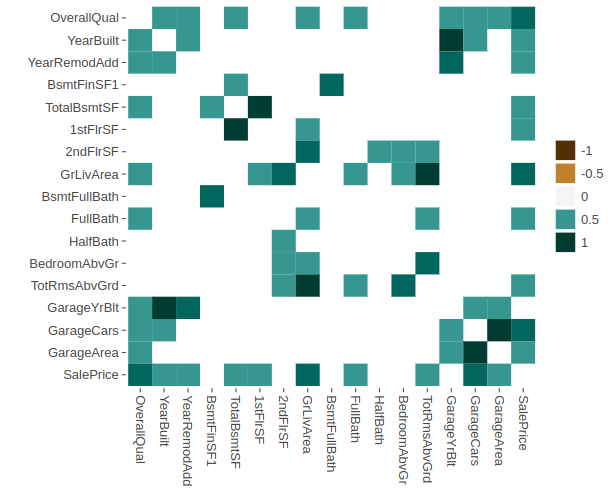
See: Correlation plot
Q-Q Plot
qqPlot - function that creates a Q-Q plot (quantile-quantile plot).
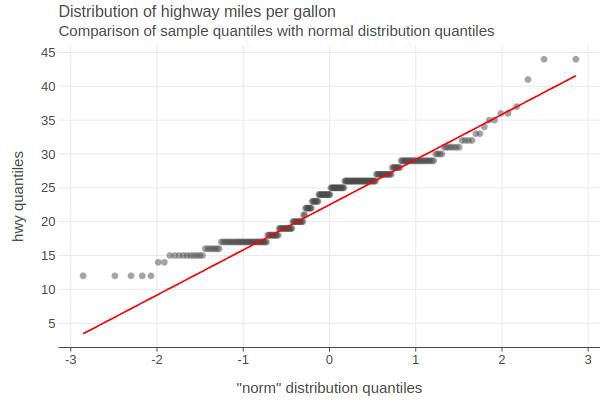
See: Q-Q plots
Joint Plot
jointPlot - function that creates a joint plot containing bivariate and univariate graphs at the same time.
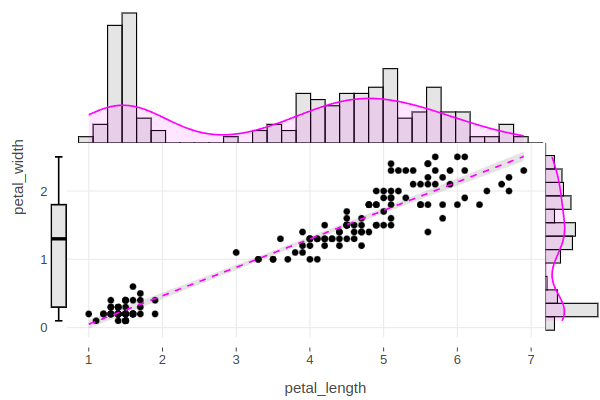
See: Joint plot
Residual Plot
residualPlot - function that produces a residual plot showing the difference between the observed response and the fitted response values.
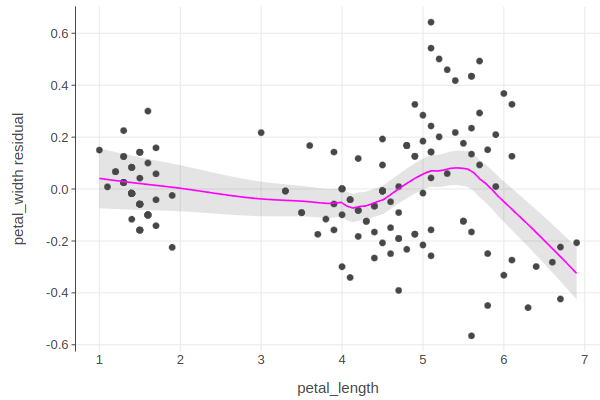
See: Residual plot
Waterfall Plot
waterfallPlot - function that produces a waterfall plot showing the cumulative effect of sequentially introduced values.
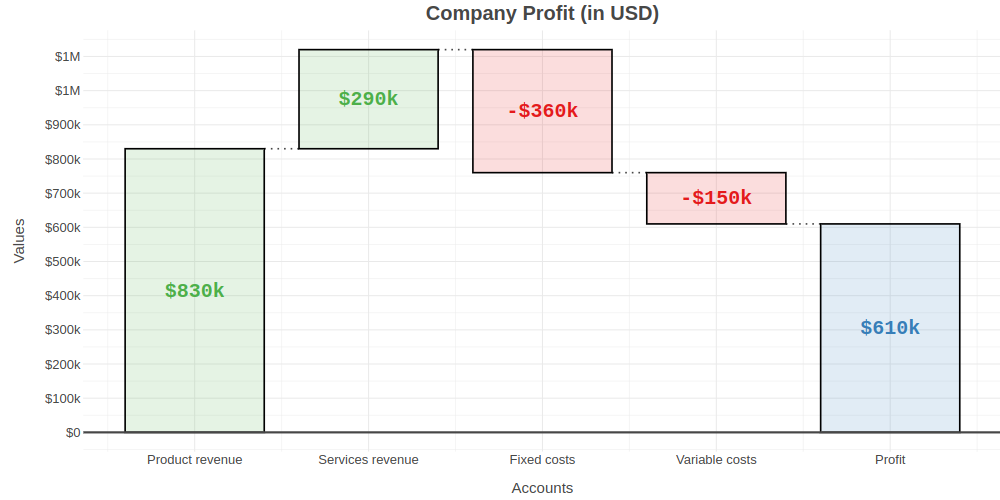
See: Waterfall plot