Working with Categorical Variables and the asDiscrete() Function
In data analysis and visualization, discrete data commonly appears as categorical variables. These can be classified as:
Nominal: unordered categories (e.g., colors, names)
Ordinal: categories with a meaningful order (e.g., education levels, rating scales)
When visualizing Pandas series in Lets-Plot, ordinal data can be represented using Pandas Categorical type with the ordered parameter set to True and a specified category order. Lets-Plot will respect this ordering in the resulting visualizations.
Alternatively, Lets-Plot provides the asDiscrete function, which offers similar capabilities for any data type, not limited to Pandas DataFrames. This function allows for flexible manipulation of discrete data, including:
Annotation of numeric data as discrete: This allows continuous variables to be treated as categorical for visualization purposes.
Specification of discrete variable ordering: The order can be based on the variable’s own values or the values of another variable.
Custom ordering through explicit "factor levels": This feature allows for manual specification of category order.
The asDiscrete function thus allows for precise control over how categories are represented and ordered in plots, regardless of the original data format.
Usage
where
variable(string) - the name of the data variable (which is mapped to the plot aesthetic);label(string) - the name of the scale - it will be used as the axis label or as the legend title;orderBy(string) - the name of the variable by which the ordering will be performed;order(integer) - the ordering direction -1for ascending direction and-1for descending (default value).
To enable ordering mode, at least one ordering parameter (orderBy or order) should be specified. By the default, it will use descending direction and ordering by eigenvalues. You cannot specify different order settings for the same variable. However, if these settings don't contradict each other, they will be combined.
The orderBy is a numeric variable, which values are used for reordering. It's also possible to use statistical variables. The reordering uses the average value. The exception is plots with the stack position adjustment, where multiple bars occupying the same x position are stacked atop one another: in this case, the sum is calculated to get the order of the stack sizes.
Examples
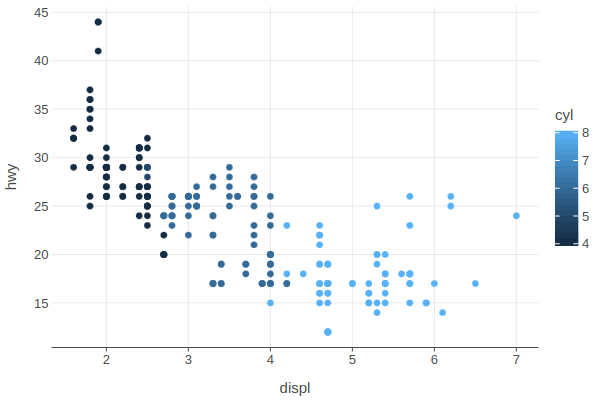
Let's annotate the 'cyl' variable as discrete using the asDiscrete('cyl') function. As a result, the data is divided into groups, a discrete color scale is assigned instead of a continuous one:
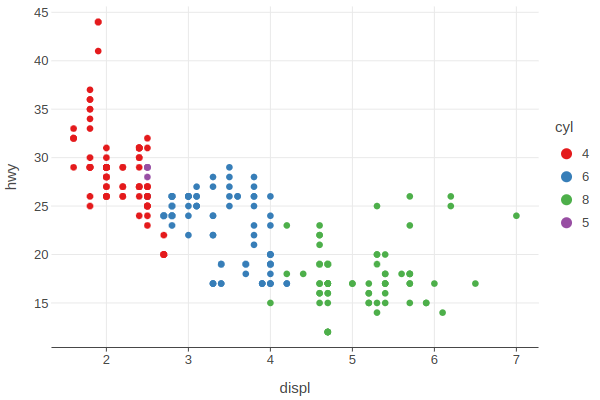
Set the 'cyl' variable in ascending order of its values:
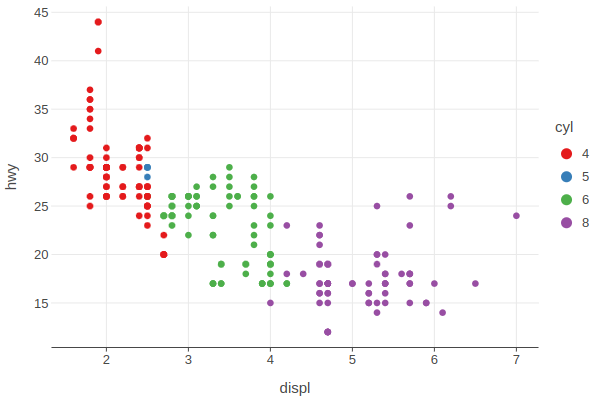
Boxplot example:
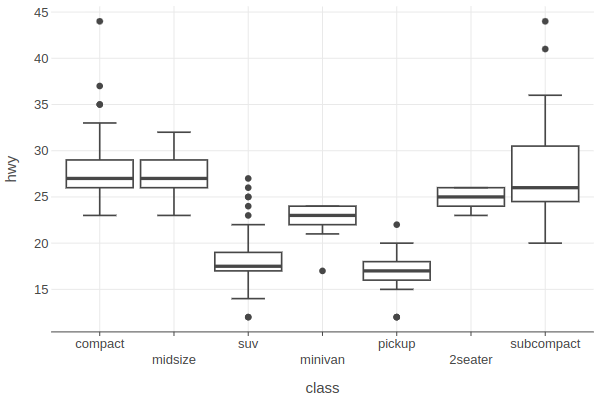
Order x alphabetically:
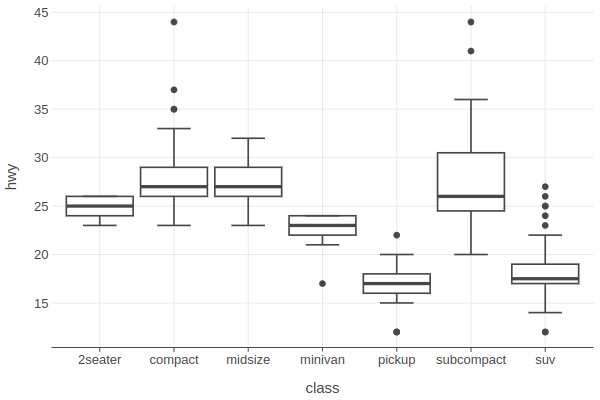
Order x by another variable - in descending order of the median:
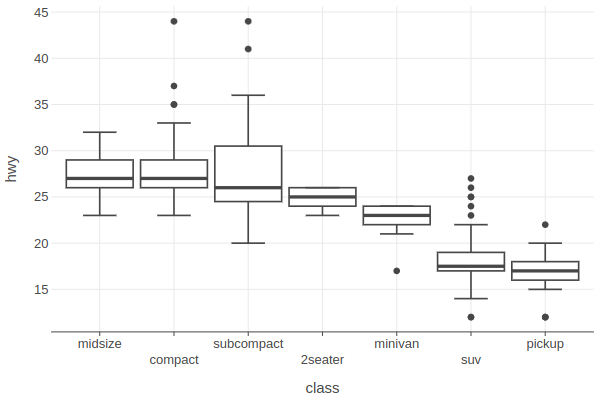
Add color associated with the same variable. The ordering is also applied to it, which will be visible in the legend:
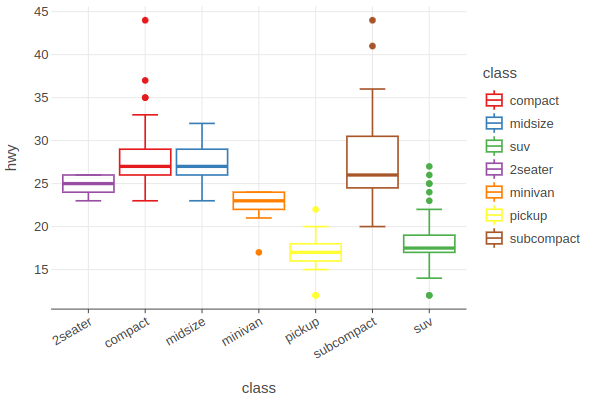
Two different ordering settings are specified for the class variable. These settings don't contradict each other. This means that they will be combined, and the variable will be ordered in ascending order ymax:
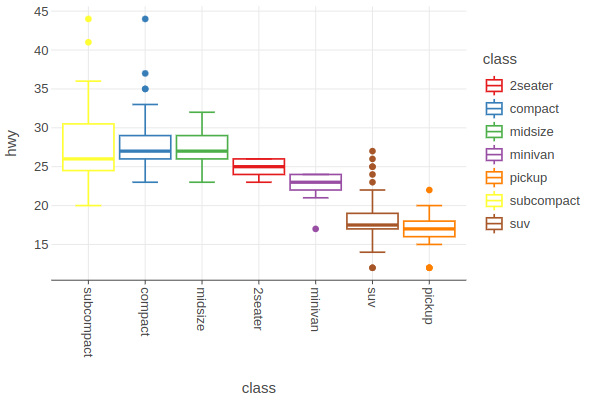
Use the levels parameter to specify the exact order for the variable:
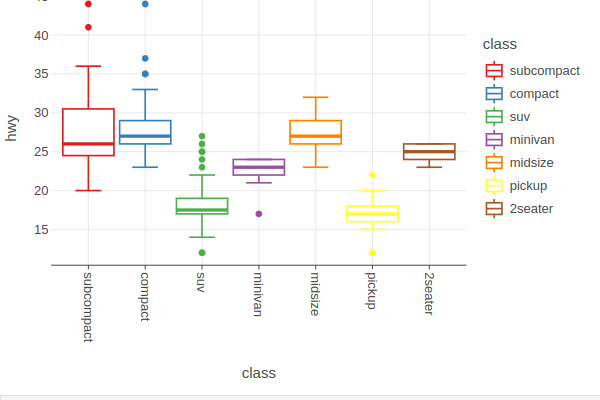
Example of ordering for two variables:
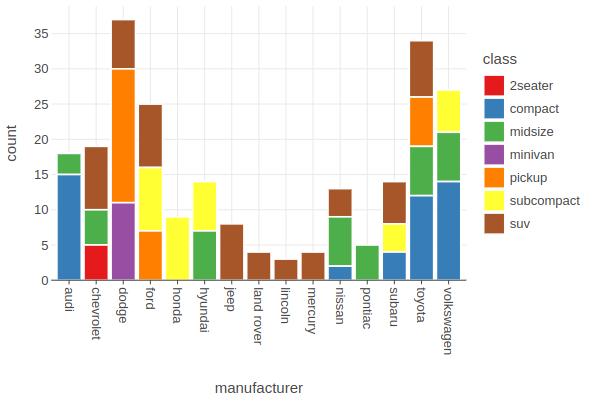
Reorder x by counts to get from highest on the left to lowest on the right:
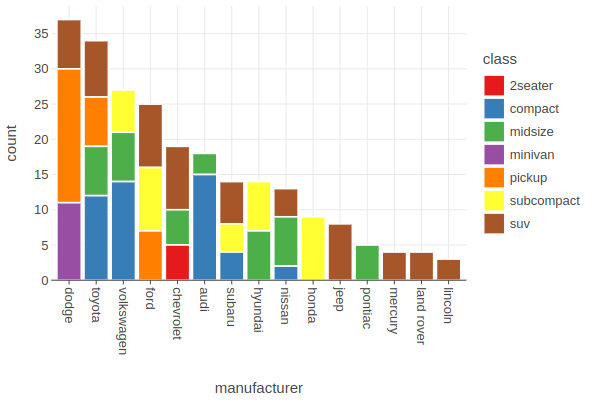
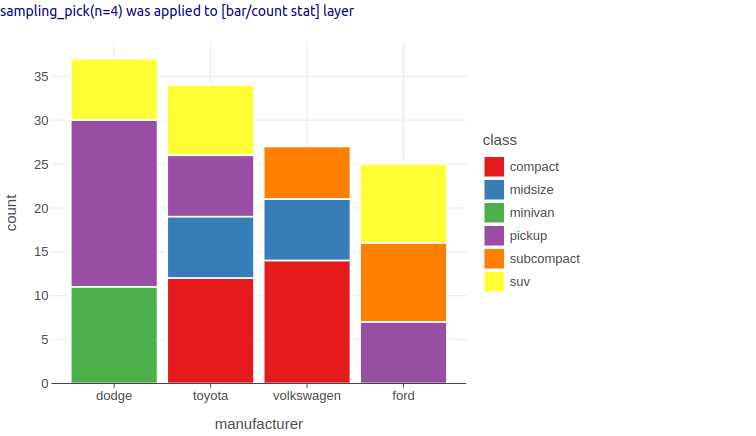
Apply sampling to the plot after reordering:
